【译文】数据可视化:现代方法
Data Visualization: Modern Approaches 的译文,由 ChatGPT-4 翻译
Data presentation can be beautiful, elegant and descriptive. There is a variety of conventional ways to visualize data - tables, histograms, pie charts and bar graphs are being used every day, in every project and on every possible occasion. However, to convey a message to your readers effectively, sometimes you need more than just a simple pie chart of your results. In fact, there are much better, profound, creative and absolutely fascinating ways to visualize data. Many of them might become ubiquitous in the next few years.
数据呈现可以是美观、优雅且描述性的。有各种常规的方式来可视化数据——表格、柱状图、饼图和条形图每天都在每个项目中被使用,并且在每个可能的场合上使用。然而,为了有效地向读者传达信息,有时你需要的不仅仅是简单的饼图来展示你的结果。事实上,有更好、更深刻、更有创造性并且绝对迷人的方式来可视化数据。其中许多在未来几年内可能会变得无处不在。
So what can we expect? Which innovative ideas are already being used? And what are the most creative approaches to present data in ways we’ve never thought before?
那么我们可以期待什么?哪些创新的想法��已经在使用?有哪些最有创造性的方法来以我们从未想过的方式呈现数据?
Let’s take a look at the most interesting modern approaches to data visualization as well as related articles, resources and tools.
让我们来看看最有趣的现代数据可视化方法以及相关文章、资源和工具。
1. Mindmaps
1. 思维导图
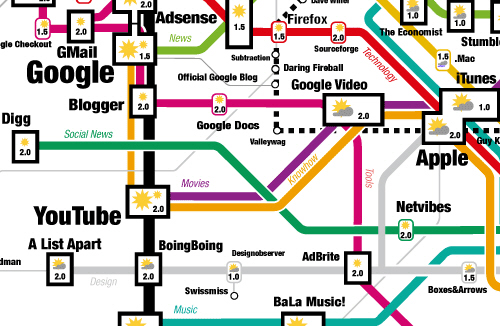
Informationarchitects.jp presents the 200 most successful websites on the web, ordered by category, proximity, success, popularity and perspective in a mindmap. Apparently, web-sites are connected as they’ve never been before. Quite comprehnsive.
Informationarchitects.jp 以思维导图的形式展示了网络上最成功的200个网站,按类别、接近度、成功度、受欢迎程度和视角排序。显然,网站之间的连接前所未有。非常全面。
2. Displaying News
2. 新闻展示
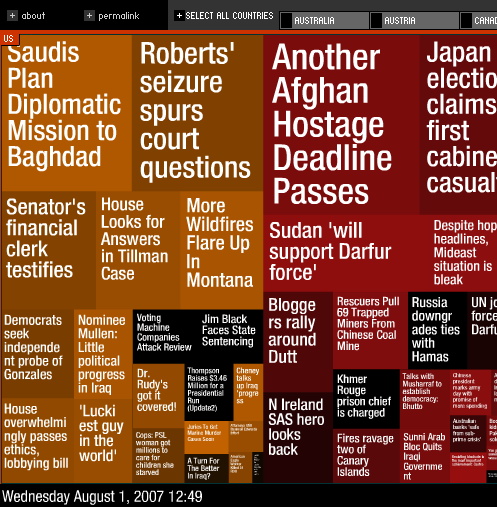
Newsmap is an application that visually reflects the constantly changing landscape of the Google News news aggregator. The size of data blocks is defined by their popularity at the moment.
Newsmap 是一个应用程序,它以视觉形式反映了 Google News 新闻聚合器不断变化的景象。数据块的大小由它们在当前的受欢迎程度定义。
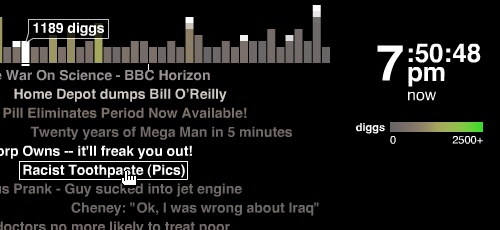
Digg BigSpy arranges popular stories at the top when people digg them. Bigger stories have more diggs.
Digg BigSpy 将受欢迎的故事放在顶部,当人们挖掘它们时。较大的故事有更多的挖掘。
Digg Stack: Digg stories arrange themselves as stack as users digg them. The more diggs a story gets, the larger is the stack.
Digg Stack: 当用户对故事进行挖掘时,Digg故事自行排列成堆栈。一个故事获得的挖掘越多,堆栈就越大。
3. Displaying Data
3. 数据展示
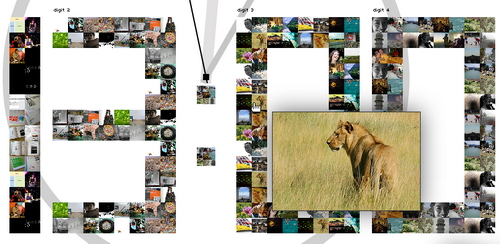
Amaztype, a typographic book search, collects the information from Amazon and presents it in the form of keyword you’ve provided. To get more information about a given book, simply click on it.
Amaztype,一个基于字体的书籍搜索,从亚马逊收集信息,并以你提供的关键词形式呈现。只需点击给定的书籍即可获得更多信息。
Similar idea is being used by Flickrtime. The tool uses Flickr API to present the uploaded images in real-time. The images form the clock which shows the current time.
Flickrtime 使用了类似的想法。该工具使用 Flickr API 实时呈现上传的图像。图像形成了显示当前时间的时钟。
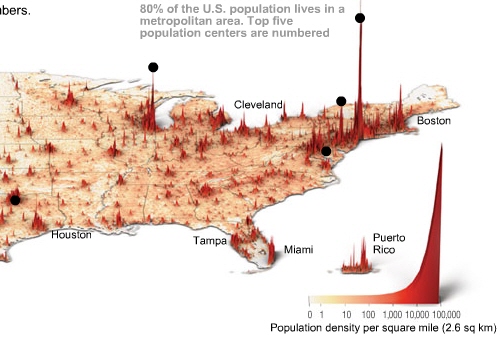
Time Magazine uses visual hills (spikes) to emphasize the density of American population in its map.
时代杂志使用视觉山峰(尖峰)来强调其地图中美国人口的密度。
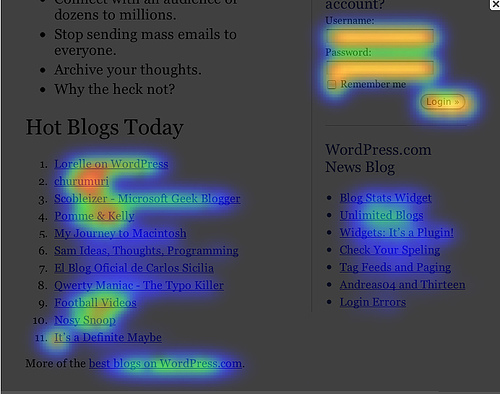
CrazyEgg lets you explore the behavior of your visitors with a heat map. More popular sections, which are clicked more often, are highlighted as “warm” - in red color.
CrazyEgg 允许你通过热�图探索访问者的行为。更受欢迎的部分,更频繁点击的部分,被标记为"热门" - 红色。
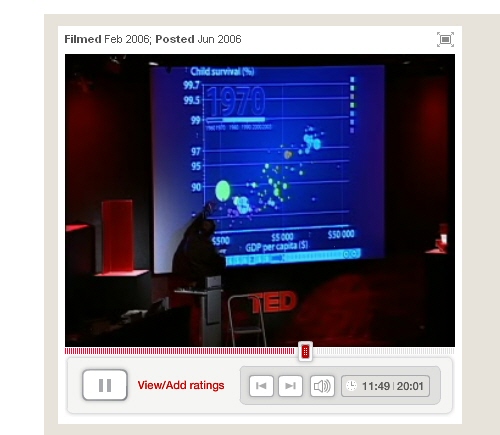
Hans Rosling TED Talk is a legendary talk of the Swedish professor Hans Rosling, in which he explains a new way of presenting statistical data. His Trendalyzer software (recently acquired by Google) turns complex global trends into lively animations, making decades of data pop. Asian countries, as colorful bubbles, float across the grid – toward better national health and wealth. Animated bell curves representing national income distribution squish and flatten. In Rosling’s hands, global trends – life expectancy, child mortality, poverty rates - become clear, intuitive and even playful.
Hans Rosling TED 讲话 是瑞典教授 Hans Rosling 的一个传奇演讲,他在其中解释了一种呈现统计数据的新方式。他的 Trendalyzer 软件(最近被 Google 收购)将复杂的全球趋势变成生动的动画,使数十年的数据变得生动。亚洲国家作为彩色气泡,在网格上漂浮 —— 向着更好的国家健康和财富前进。代表国民收入分布的动画钟形曲线挤压和平坦。在 Rosling 的手中,全球趋势——预期寿命、儿童死亡率、贫困率——变得清晰、直观,甚至有趣。
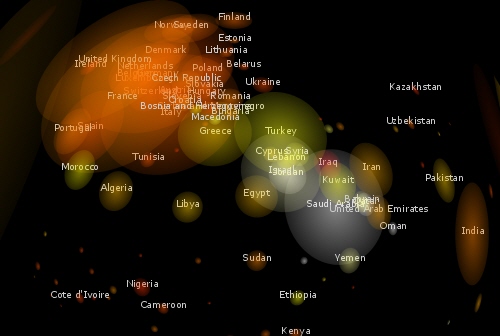
Three Views shows three views of the earth, in which each country is represented by a circle that shows the amount of money spent on the military (size of circle) and what fraction of the country’s earnings that uses (colour). Compact and beautiful presentation of data.
Three Views 展示了三个地球视图,在这些视图中,每个国家都用一个圆圈表示,显示在军事上花费的钱(圆圈的大小)以及它使用的国家收入的比例(颜色)。紧凑而美观的数据呈现。
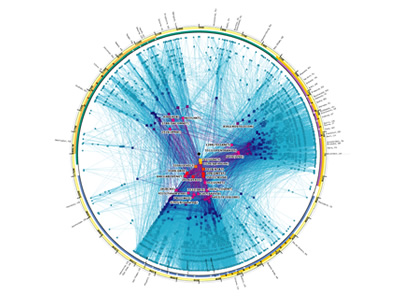
Visualizing the Power Struggle in Wikipedia displays the most popular articles and the most frequent search queries in the heatmap.
维基百科权力斗争的可视化 在热图中显示了最受欢迎的文章和最频繁的搜索查询。
4. Displaying connections��
4. 展示连接
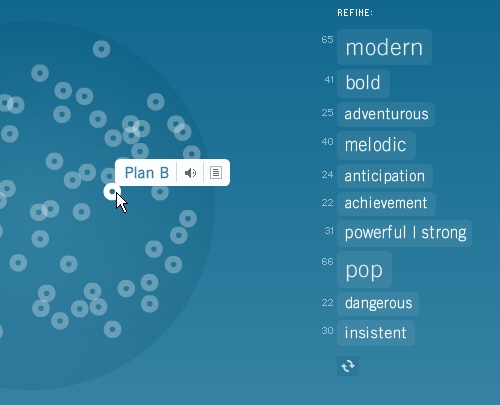
Burst Labs suggests similar or connected items to your search queries (favourite artists, tv shows, movies, genres etc.) in a bubble. Not really new, but still inspiring.
Burst Labs 以气泡的形式建议您搜索查询(喜爱的艺术家、电视节目、电影、流派等)的相似或相关项目。并不真的新鲜,但仍然启发人心。
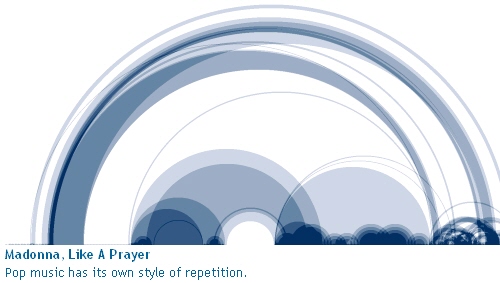
Shape Of Song: What does music look like? The Shape of Song is an attempt to answer this seemingly paradoxical question. The custom software in this work draws musical patterns in the form of translucent arches, allowing viewers to see - literally - the shape of any composition available on the Web.
Shape Of Song:音乐看起来像什么?Shape of Song 是尝试回答这个看似悖论的问题。这个作品中的自定义软件以半透明的拱形绘制音乐图案,允许观众字面上看到 - 歌曲的形状。
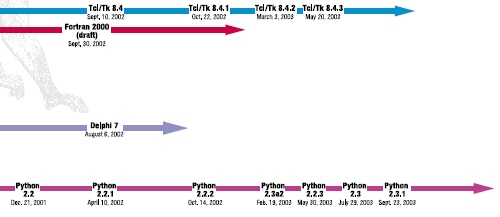
Lanuage Poster proves that even simple lines can be descriptive enough. The History of Programming Languages as an original timeline.
Lanuage Poster 证明即使是简单的线条也可以足够描述性。编程语言历史作为一个原创时间线。
5. Displaying web-sites
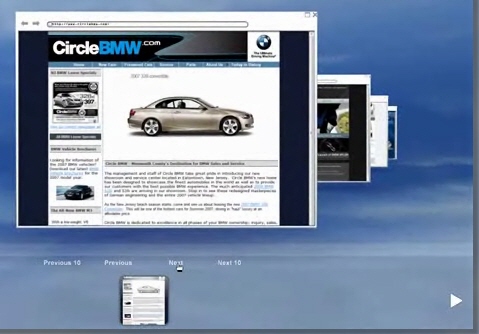
Spacetime Flash offers Google, Yahoo, Flickr, eBay and images in 3D. The tool displays all of your search results in an easy to view elegant 3D arrangement. Company promises that the days of mining through pages and pages of tiny thumbnails in an effort to find the item you are looking for are over.
Spacetime Flash 以3D展示 Google、Yahoo、Flickr、eBay 和图像。该工具以一个易于查看的优雅3D布局展示所有搜索结果。公司承诺,翻阅数页微缩图以寻找您正在寻找的项目的日子已经结束。
6. Articles & Resources
6. 文章和资源
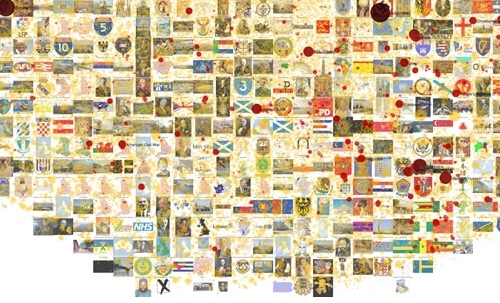
The project presents the most beautiful methods of data visualization as well as further references and book suggestions. The gallery has over 450 entries.
该项目展示了数据可视化的最美丽方法以及进一步的参考文献和书籍建议。图库有超过450个条目。